 In order to get traffic to your site consistently, you have to get audience interested and engaged. Understanding your target audience is one of the most important parts of this process. By understanding where most of visitors are located, when are they likely to visit, what pages do they look at before making purchase, which pages are the most engaging…etc, you are likely to get lots of insights and directions to make your site better for your visitors so they will stick longer and at the same time your site will also attract more similar visitors.
There are many web analytics tools out there that can help you get this kind of insights. We highly recommend to start with , it’s powerful, got everything you need and best of all, it’s FREE. Here are the steps to get start with :
Step 1: Sign up for a Account and Add your website
Use your Google Account to sign up a GA account, follow the instruction on GA to add your website: first go to Admin, click on +New Account, then follow the instruction to setup a new account for your website.
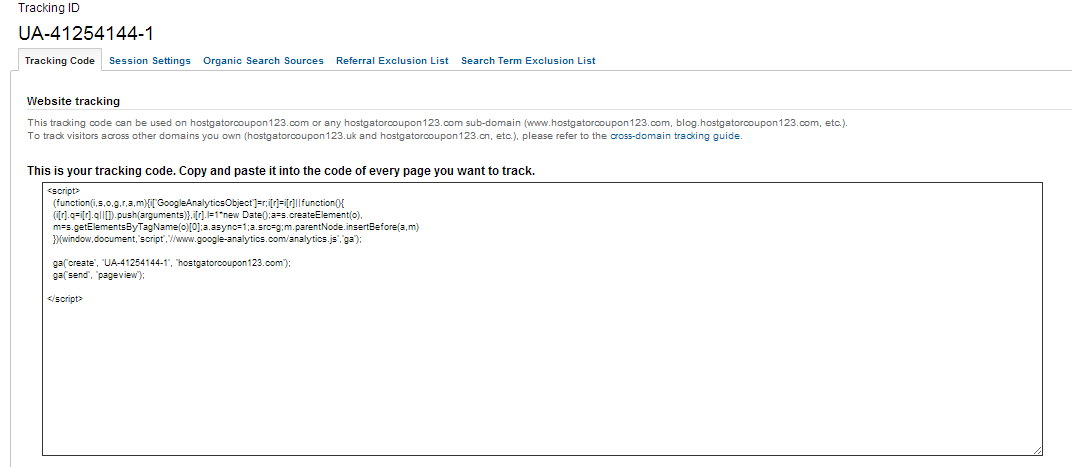
Step 2: Adding the Code
After you setup your GA account and have added your website, you will need to implement the code on your website to allow Google to track. If you are using , Blogger or Tumblr, it’s really easy to setup. Just add the tracking code to your theme template. Copy the code from GA and paste it before </head> in the theme template, then it will be propagated to all pages and posts on your website.
If your site is custom built, then you will need to either add the code to each page or talk to your web developer to see a way to implement the code.
Step 3 Know the basics
Once you have setup your GA account, and added the code to your website, it’s time to measure. But before that, you should know the basic language of web analytics.
Page: A unit of web content
Page Views: the # of times a page was viewed
Visitors/Sessions: A visit on the page (a unit of web content) by visitors. If a visitor does not perform any additional action (click on link to go to another page) within a specific time frame, the visit session will end.
Unique Visitors: the # of unique visitors (tracked by IP address and time frame) visit the site. Each person is counted only once in the unique visitor section for the reporting period.
Landing Page: A page that intended to be the entry point of visitor’s experience for a specific marketing effort.
To learn about the basic metric definition of Web Analytics, please click here to download the full report.
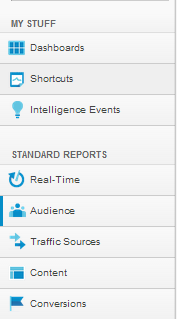
Traffic Sources: this basically tells you how people got to your site. If have different implemented different marketing effort such as social media, press release,…etc, this is a good way to know which one is the most effective in driving traffic to your site.
Content: here you will be able to delve deeper to the content of your web page. You can see how people enter and exit your pages and see which content is the most popular. You can also see the AdSense performance here.
Audience: this tab helps you to understand your visitors better. You can view things about your visitors such as the demographics, behaviors, how people access your site (mobile vs computer). You could even build your custom report about your audience.
Conversions: this tab is very important if you are doing affiliate marketing, selling products, getting registrations…etc on your website. Basically it allows you to keep track of your goals. But before you start to use that tab, you have to set it up. Just follow the on screen instruction when you click on the tab to set up.
Step 4 – Setting up the Dashboard
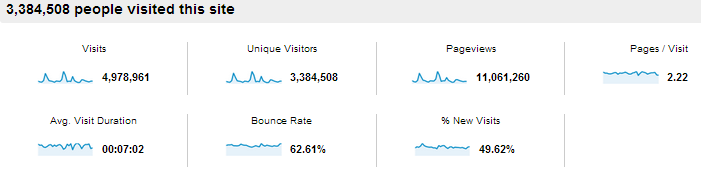
On the main dashboard, you will be able to see a visual summary of your site’s data. You are able to customize the dashboard to only show the data you are interested in. If you want a specific report to show on the dashboard, just hit “Add to Dashboard” on the left column and you will then able to move that report wherever you want on the main dashboard by dragging and dropping.
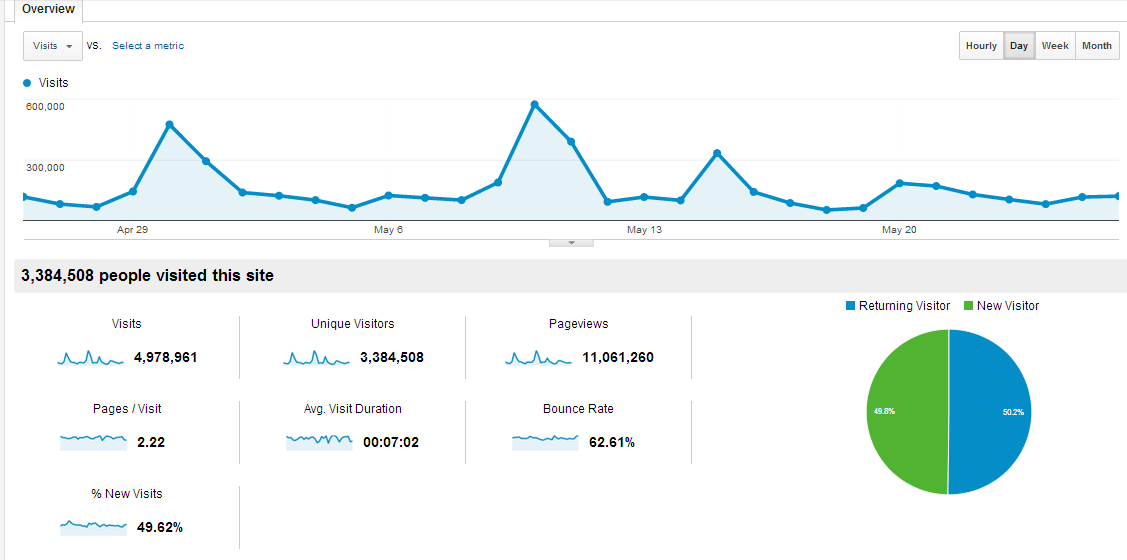
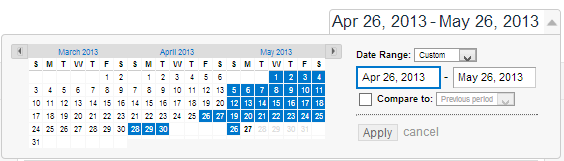
Also make sure the data you are viewing is within the date range. The date range is in the upper right-hand corner. Just click on the data range and a calendar will pop up. You can choose to measure just one day, or a specific date range. If you want to compare data ranges, just click on compare to: , then choose the date range that you want to compare to. Everything is very intuitive, just play around to learn all the features.
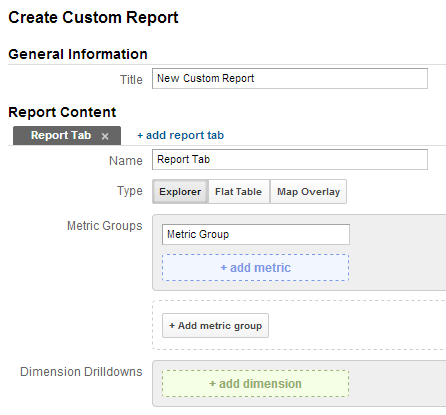
Step 5 – Custom Reports
This can be a very powerful tool once you learn to use it. Basically, it allows you to create customized reports based on your chosen metric, dimensions and filters. For example, if you want to track specific page in term of demographic, visitor duration, keyword..etc, you will be able to do it here. After you’ve created the report, you will also be able to apply this report to other sites.
Step 6 – Sharing Report
Sharing your report on GA is easy. You will see Email on the top of all reports. You can send that specific report through email or schedule a recurring report email. You can also export the report to Excel, Google Spreadsheets or PDF.

Okay, this is it. is a very powerful tool that will help you understand your visitors better and make your site better, which will then increase the traffic to your site and up your revenue.
Google+